3 caching steps to boost your webservice by x10

I am running a IP-Geo-location demo in my App Engine. After many silent months I got some traffic on it (and hitting the daily CPU limit). Some one would kick the "traffic monster", after all it's starts only as a demo, other ones (like me) will try to optimize the GEO-location script.
When you read the message "This Google App Engine application is temporarily over its serving quota. Please try it again later" (or simply a HTTP-Status 503) you can activate the App Engine billing option. Or it's time to start caching in the different application levels:
- cache external resources - they are slow and unpredictable
- cache internal resources - lookups to database and rendering the output can be cached
- use the browser cache - webservices can be cached with basic http usage
introduction for the caching article
What is the IP-Geo-Location webservice? After including a small javascript you can access to the geo location of a normal visitor based on his IP address. The service can be a door opener for different landing pages or localized content. You can forward the visitors (by identifying his home location/city) to special local sites or offer local ads.
other articles about the geo location
- the tutorial how to use ip to geolocation provider api
- the free usage ip to geolocation aggregator script
- the php stand alone implementation
- the python Google App Engine implementation
The described caching steps works perfectly if you do not need to invalidate your cache. This detailed example only reads from external resources and can use long caching times. After some improvements I got a speed up of factor 10! Or in other words: from 50.000 requests/day I increased the App Engine capacity to 500.000 requests/day (and hitting the cpu limit again ...) All logged times come from the logfiles and profiling with Appstats helps with the sequence diagrams (generated live).
The profiling images are examples of the google Appstats tool in the App Engine and show live examples of requests. Its slow down your engine up to 10% (on high load) and saves all statistics in memcache. There are different values in the graphics:
- blue cpu time: time "wasted" in my own python code
- red api cpu time: time needed by the services (memcache, database, fetch and many more)
- requests total time: time for the request, can stopped in the browser
What we have to optimize
The basic webservice requests have to do the following steps:
- accept a GET request (param is the calling IP) on a javascript-url
- ask up to 4 web-service for data
- generate resultString as javascript code
- return the resultString
The result is a dynamically generated javascript wich contains only the data. A second static script with functionality over this values is added as a static file and google does all the caching stuff for static content. There are functions for finding the next city in a given set or calculate the distance of the visitors home and your given location.
- var com = com||{};
- com.unitedCoders = com.unitedCoders||{};
- com.unitedCoders.geo = com.unitedCoders.geo||{};
- com.unitedCoders.geo.ll = [{"lat": -21.78330, "city": "Araraquara", "name": "maxmind", "long": -48.16670, "country": "Brazil"}];
-
Costs: every request results in 4 calls to webservices
- not much cpu, no local storage, long running (depend on slowest webservice)
- worst case: up to 2 seconds, but on average 100 ms cpu-time
cache external resources
Notes: Not every used webservice will give results for every called IP and the free daily amount of web-service-calls are limited. Second the assignment between IP and location will rarely change - an ideal setup for caching on application side. A long time cache like a local database with timestamp is a good choice for saving requests to the webservices and a short time cache for faster lookups.
- accept an GET request (param is the calling IP) as a javascript-url
- check if result is in local database
- otherwise ask up to 4 web-service for data
- save the results in the local database
- generate resultString
- return the resultString
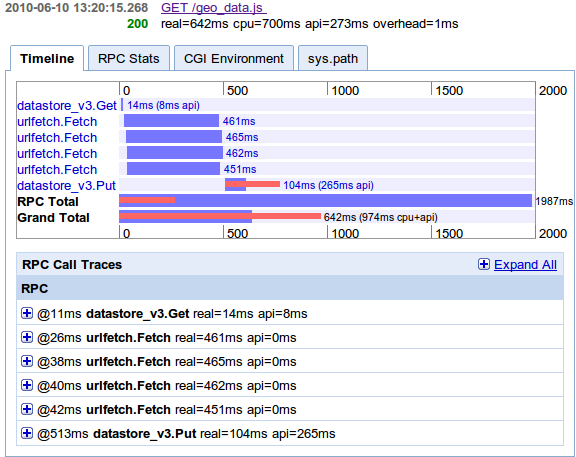
The profiling image shows the result. It tests if the IP is in the local database - this is implemented as a keyname call (in sql syntax a request to the primary index) and very fast. If not it starts 4 parallel requests to the webservices and transforms the results. Then it saves it in the database and returns the result. This does require expensive resources and can have long request time (depending on the webservices).
Personal experiences: After running this with many visitors, my database filled with known values and the count to call the webservices will go down. I got after 10 million requests (from one site in brazil) an 97% hit chance (this will highly depend on the calling visitors and the saved data!!!) in my database!
-
Cost: 3% of requests fetch from 4 webservice and writing into database
- longtime usage on the storage
- real=642ms cpu=700ms api=273ms overhead=1ms (8 RPCs)
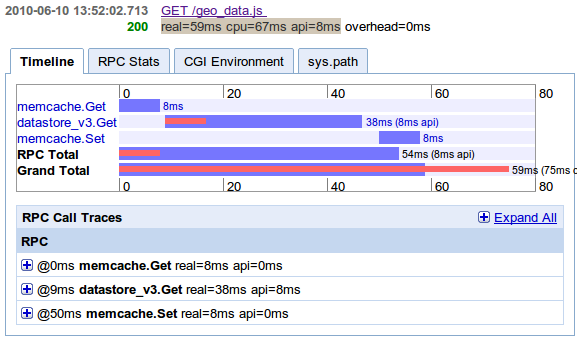
If the result is in the local database the request can use the saved result and therefore is fast. I used a keyname (like primary index on sql databases) to find the record for the called IP. The time for finding the result is nearly constant for the first 100.000 records I tested in my App Engine instance.
-
97% of requests reads from database
- normal time, some cpu, many memory
- real=59ms cpu=67ms api=8ms
cache internal resources
Using local caching or the fast memcached is the classic way - every call to a database can be cached in memory too. Saving data in the memcache is fast and can be made asynchronous - no waiting time. The memCacheD is a standard service in the App Engine and should be faster than the distributed bigtable.
- accept an GET request (param is the calling IP) as a javascript-url
- check if calling IP in memcache -> return it
- check if result is in local database-> return it
- otherwise ask up to 4 web-service for data
- save the results in the lcoal database
- generate the resultString
- dump the resultString in memcached
- return the resultString
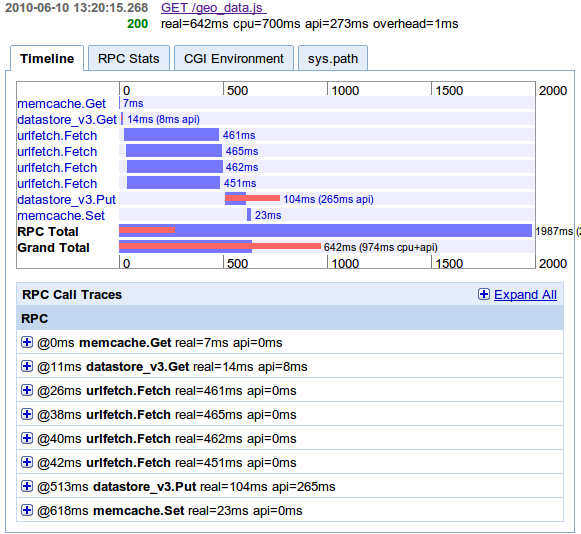
The complete and worst case request is only a little bit more expensive than the basic call. It is asking the memcache and than the local database. If no data is found calling all 4 webservices. The result has to be transformed and saved in local database (saving is not asynchronous in the App Engine) and memcache.
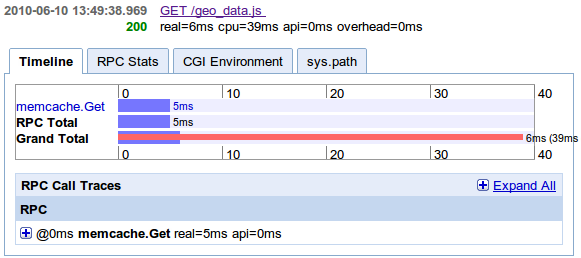
If the request found a hit in the memcache all is very fast!
If the script found the record in the database, it has to save it in memcache and return the result. See here for some python code lines for doing this in the App Engine. The function computeData tries to read the record from the database. If not found start the webservice calls, saving into database and returning the record.
- def get(request, response):
- resultCacheKey = "geo_data(%s)" % request.get("ip")
- resultStr = memcache.get(resultCacheKey)
- if resultStr:
- response.out.write(resultStr)
- return
- #some code
- result = computeData()
- resultStr = self.pageTemplate.render(Context(result))
- memcache.set(resultCacheKey, resultStr)
- response.out.write(resultStr)
- #get
-
Cost:
- 3% requests to 4 webservices
- 67% hit rate in database (long-time cache)
- 30% hit rate in memcache (short-time cache)
- fast, minimal cpu, some memory
- real=6ms cpu=39ms api=0ms
Tip: Don't cache the database result directly (with wrapper or annotations). Try to dump the webservice result in memcache as late as possible. You next memcache hit does not need to convert the result data.
use the browser cache
Some calling browser/IPs (not only anonymous proxies with the same IP) come several times an hour - I don't know why. The result depends on the calling IP - not by the url - it can't be cached for all caller transparently. I defined in the http response header one hour as the private cache time - in this period the location should not change dramaticaly and the browser should load the script from his browser cache.
- Cache-Control: max-age=3600, private
- response.headers["Cache-Control"] = "max-age=3600, private"
- response.headers.add_header("Etag", request.get("ip"))
- if request.headers.get("If-None-Match", "") == request.get("ip"):
- response.set_status(304)
- return
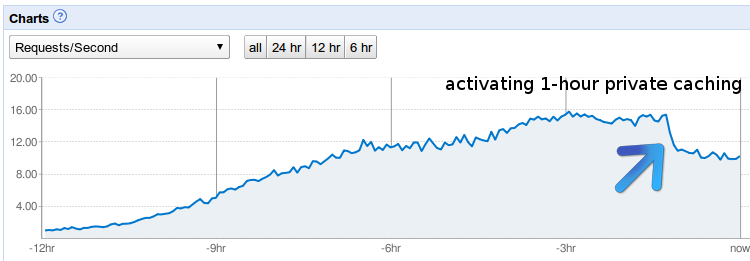
The activated cache-control option decreased the request count by 30% and increased the capacity for the app! The cpu load did not dramatically change because the old requests were caught by etag check or by memcache cache hits.
Requests with an adequate etag will only cost checking the header and is reported with the minimum cpu ms (19ms) in the log files. After active cache-control settings every 20 requests an etag logline appeared. The example with the Etag matching can also be used on url-parameters or cookie-values.
Check your webservice with the cache header test tool from Resource Expert Droid or read more caching hints in http://mnot.net/cache_docs/.
Request rate before and after optimization
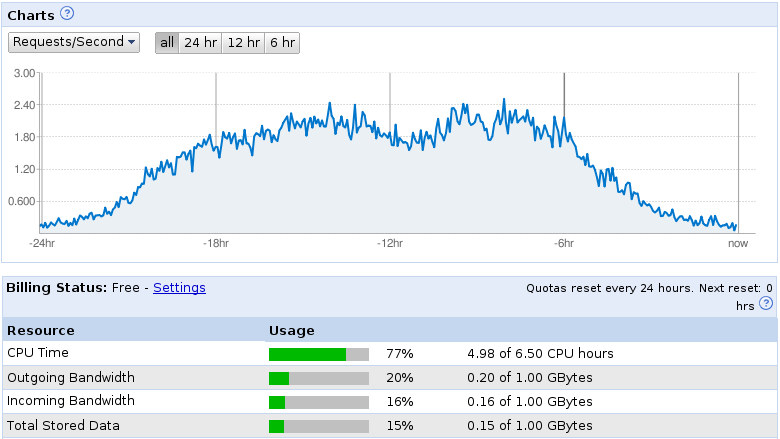
Here you can see the daily statistic on the App Engine dashboard with a 2 requests/seconds maximum and 50.000 requests/day. I got some more traffic and the result was the Overload screen (started with this image in the article).
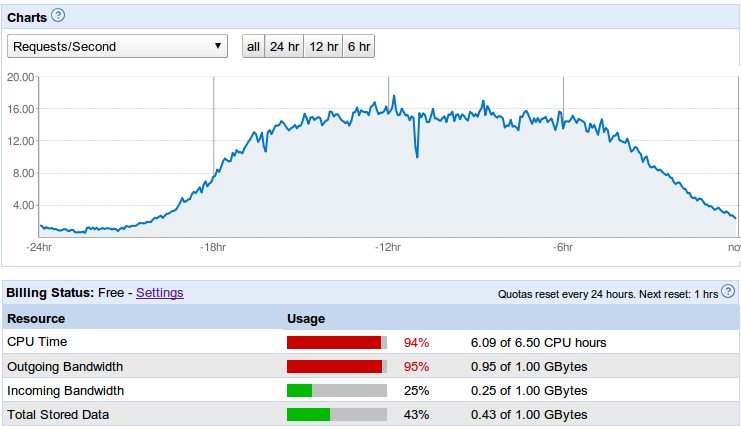
With the prior noted improvements the free and basic Google App Engine runs with up 20 requests/second. The daily traffic of 400.000 requests/day can now be handled. Altering my App Engine code was fun and it was exciting to see if I can stay below the daily 6.5 hour cpu limit, or if the cpu limit was ok but the bandwidth limit will become the new challenge.
Consumption
I hope this helps to find optimization options for your webservice on the server and client side! If you have more tips or questions, ask for it. If you want to check your website try out the yahoos yslow or google page speed plugins for basic client checks or the profiling tools Appstats on google app engine.
- Login to post comments
Comments
3 caching steps to boost your webservice by x10 | united-cod (not verified) - Mon, 07/26/2010 - 20:39
[...] See the article here: 3 caching steps to boost your webservice by x10 | united-coders.com [...]
Alex (not verified) - Tue, 03/22/2011 - 15:03
Wow, great article!